Stop learning about outages from customers with our Prometheus Grafana Monitoring Script
Stop learning about outages from customers with our Prometheus Grafana Monitoring Script
4 June 2025
Jessica Verlinden

“The payment API is timing out. Several customers reported issues.”
That message from your support team is how you learn about the problem. Not from your monitoring system, but from your customers. You immediately start investigating, but valuable time has already been lost.
This scenario is all too common. Without proper monitoring, you’re constantly in reactive mode, and your customers become your monitoring system by default. Nobody wants that. That’s exactly why we built this Prometheus and Grafana monitoring script.
What’s in our Prometheus with Grafana script?
Our Prometheus & Grafana monitoring script gives you a head start on building a professional monitoring stack with:
- A practical two-server architecture (operations server + applications server)
- Ready-to-run Docker configurations for containerized deployment
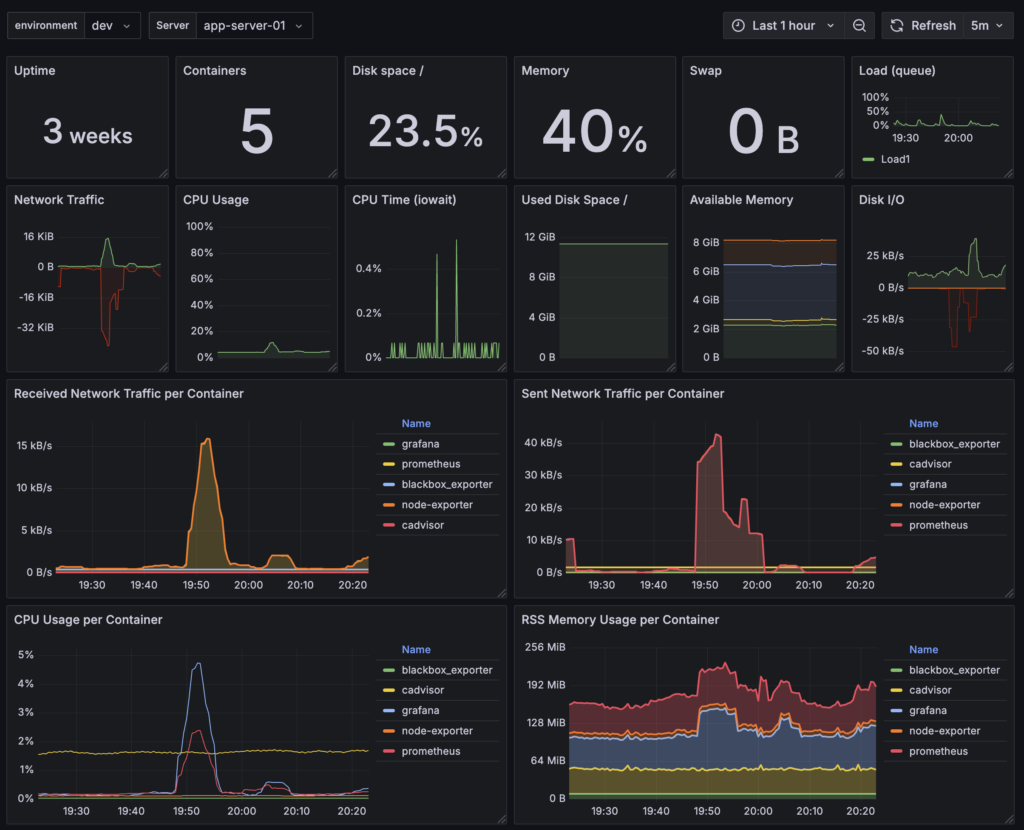
- Pre-built Grafana dashboards so you don’t start from scratch
- Basic alerting configuration to notify you when things go sideways

When to implement this monitoring stack
Finding yourself in any of these situations? This template is for you:
- Your team is tired of being blindsided by problems users discover first
- You’re running containerized applications but lack visibility into their health
- You need to monitor both infrastructure and application metrics in one place
- You’ve been wanting to set up proper monitoring but haven’t had time to build it from scratch
- Your current monitoring setup is fragmented across different tools with no unified view
Important considerations for Grafana monitoring
While our template gives you a solid foundation, remember:
- Adjust the scrape intervals in prometheus.yml based on your specific needs. The default settings might collect too much or too little data for your infrastructure.
- Review the alert thresholds before deploying. What’s critical for one system might be normal for another, especially in containerized environments.
- Storage considerations: The default configuration stores metrics locally. For production environments with multiple containers, you might want to configure persistent storage or remote write endpoints.
- Kubernetes integration: If you’re running in Kubernetes, consider how this setup integrates with your cluster management and ensure proper network policies.
The “test before you deploy” reminder
We can’t stress this enough: this template is a starting point, not a one-size-fits-all solution. Every environment is unique, and what works for us might need tweaking for you.
Please test thoroughly before deploying to production.
The Prometheus Grafana Monitoring scripts we provide are tools to get you started – they’re not magical solutions that work perfectly in every scenario. Use them as building blocks, understand what they do, and adapt them to your specific infrastructure needs.
Get the Docker Prometheus Grafana template
Ready to stop letting your users be your monitoring system? Grab our Prometheus and Grafana Monitoring Stack template from our GitHub repository.

Sorry, the comment form is closed at this time.